What is business intelligence, and how does it help leaders decide?
Business intelligence is not more charts. It is a short list of trusted numbers that tell each team whether things are on track and what to do next.
Key takeaways
- Good BI means fewer, trusted numbers, not more charts.
- Start with decisions and KPI definitions before designing dashboards.
- A semantic model keeps every report calculating measures the same way.
- The work that makes BI reliable is the same work AI needs.
Live Bilingual Ministerial Reporting
An SDAIA-aligned data platform with Arabic-English ministerial dashboards.
- Sovereign Data PlatformIn-country hosting, NDMO-aligned
- Vision 2030 KPIsLive tracking of national NTP indicators
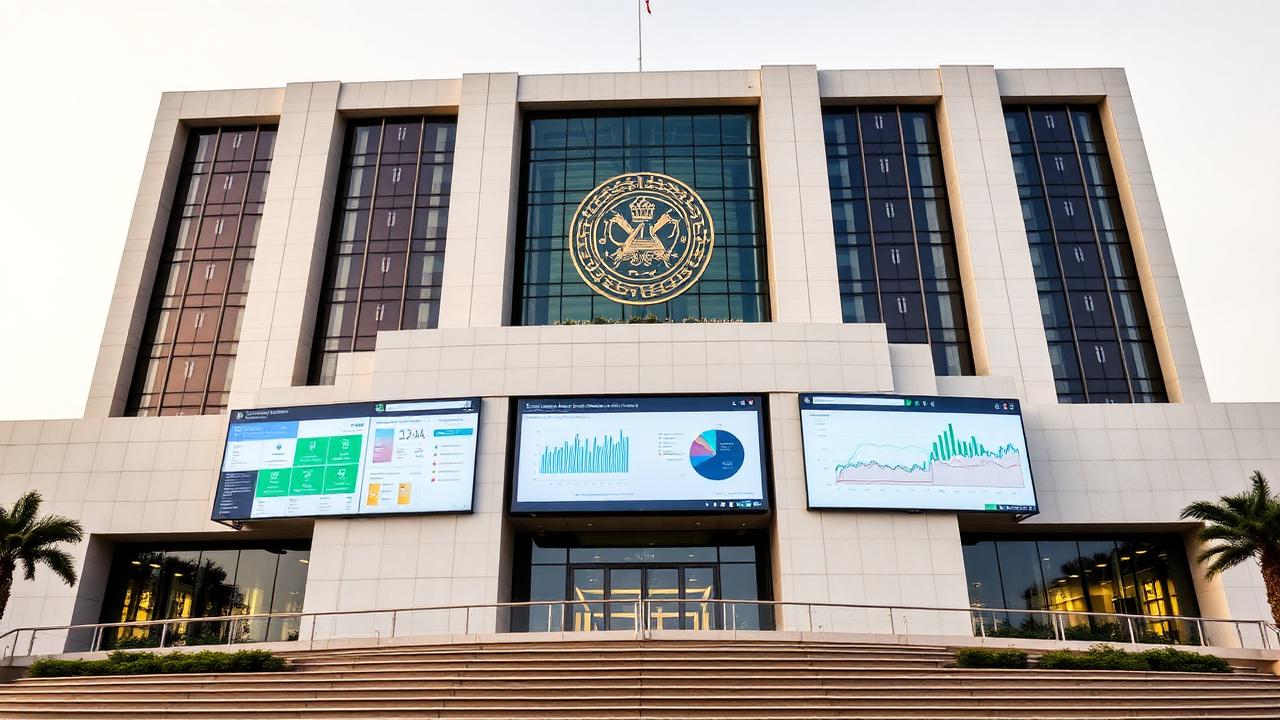
“Ministerial reporting moved from monthly PDFs to live bilingual dashboards, every Vision 2030 KPI updated daily and shared across agencies.”
Quick answer
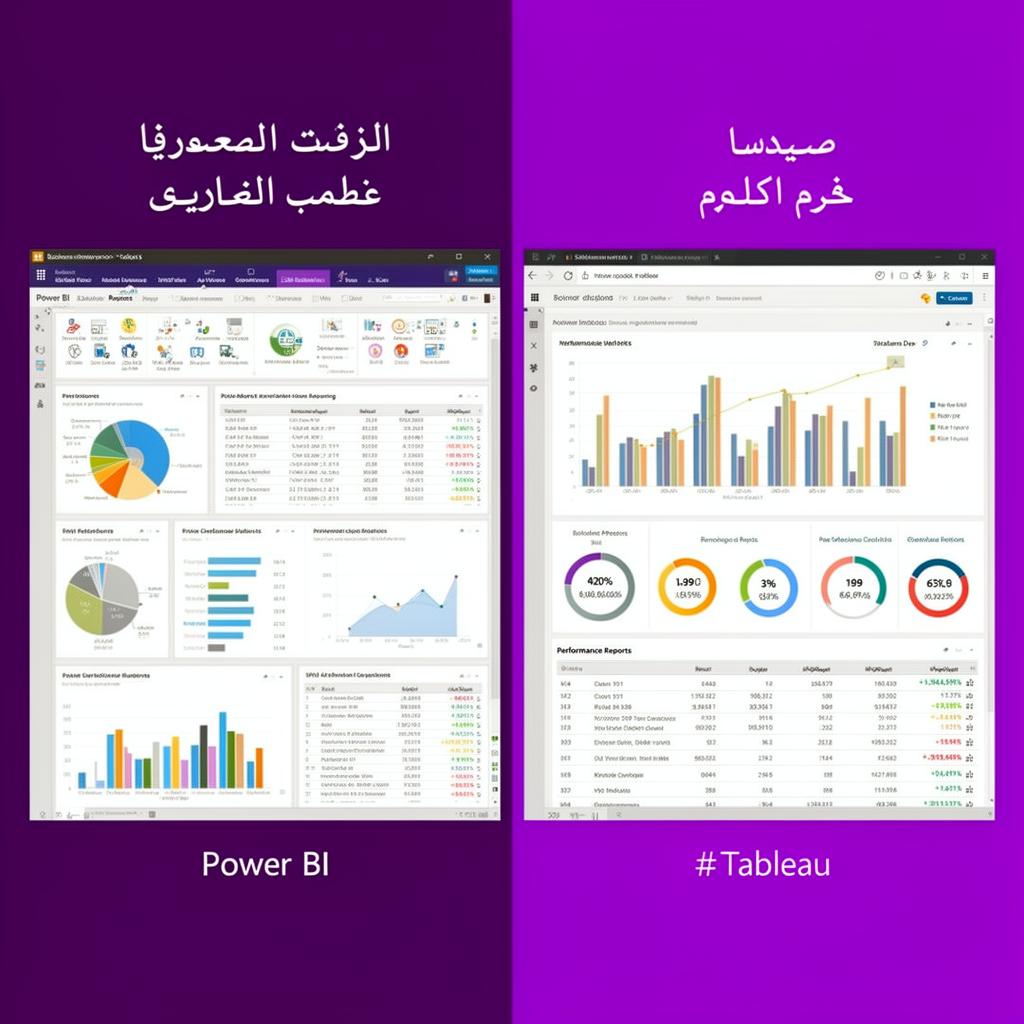
Business intelligence (BI) is the practice of turning company data into consistent, timely information that people use to make decisions. In practice it combines a reliable data source, agreed KPIs, and dashboards or reports in tools such as Power BI or Tableau. Good BI does not mean more charts. It means leaders see the few numbers that matter, trust them, and know what to do when one of them moves.
Business intelligence versus reports and spreadsheets
Most companies already have reports. The difference is consistency and automation. A spreadsheet report is usually assembled by hand, depends on one person and can quietly change definition from one report to the next. A BI setup pulls data automatically from source systems, applies the same definitions every time, and lets users move from a summary figure down to the transactions behind it.
Start with decisions and KPIs, not the dashboard
The most common mistake is to begin by designing screens. Begin instead with questions:
- What decisions does this team make on a regular basis?
- Which measures tell them whether things are on track?
- What is the exact definition of each measure, and who owns it?
- What target or threshold should trigger action?
- Who needs to see it, and how often?
A finance director, a branch manager and a contact-centre supervisor need very different views. A short list of well-defined KPIs for each role is worth more than one large dashboard for everyone.
What a good BI setup includes
- A trusted data layer, usually a data warehouse or lakehouse, so reports do not query live systems directly.
- A semantic model that holds measures and definitions once, so every report calculates revenue the same way.
- Role-based dashboards with a clear summary, trends and the ability to drill into detail.
- Row-level security, so each user sees only their region, branch or department.
- Refresh and monitoring, so people know how current the data is and failures are caught early.
- Arabic and English support where teams work in both languages, including right-to-left layout in Arabic reports.
Why many dashboards go unused
- The numbers do not match what finance reports, so people stop trusting them.
- They show everything and highlight nothing.
- No one is accountable for acting on what they show.
- They were built once and never adjusted as the business changed.
Fixing these problems is mostly about definitions, ownership and design, not about changing tools.
How BI prepares a company for AI
The work that makes BI reliable (clean source data, agreed definitions, documented KPIs and access rules) is the same work AI needs. An AI assistant that answers questions about sales is only as good as the sales model underneath it. Companies with solid BI usually find it much easier to add forecasting, alerts and AI agents later.
Next step
Bilytica builds KPI-first business intelligence on Power BI, Tableau and Microsoft Fabric for teams that need numbers they can act on. Talk to us or see our business intelligence service.
Frequently Asked Questions
What is the difference between business intelligence and data analytics?
Business intelligence focuses on consistent reporting of what is happening, through agreed KPIs and dashboards. Data analytics is broader and includes investigating why things happen and predicting what may happen next.
Which tools are used for business intelligence?
Common tools include Microsoft Power BI, Tableau and Qlik, often on top of a warehouse or lakehouse such as Microsoft Fabric, Snowflake or Databricks. The data model and KPI definitions matter more than the tool.
Can BI dashboards work in Arabic?
Yes. Major BI tools display Arabic text, but right-to-left layout, fonts and mixed Arabic and English labels should be tested with real reports before rollout.
How many KPIs should a dashboard show?
As few as the role needs to make its decisions. A short list of well-defined measures per role is more useful than one large dashboard for everyone.
Want These Results for Your Company?
Book a free AI assessment and see exactly how much you can save, with numbers, not buzzwords.