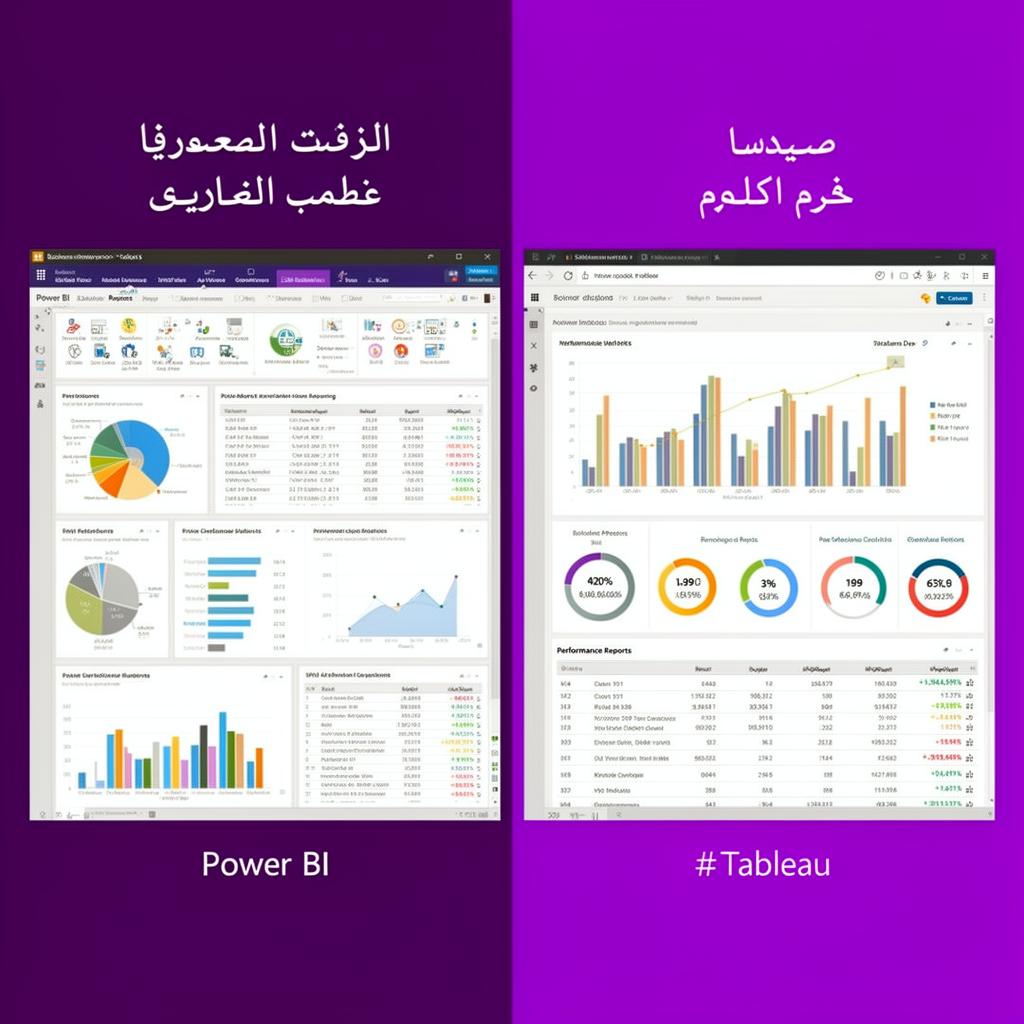

Power BI or Tableau: how should a company choose?
A neutral comparison of Power BI and Tableau for companies: where each fits, Arabic and hosting checks, licensing, and a simple way to decide.
Key takeaways
- Your existing technology estate usually decides more than features.
- Power BI fits naturally with Microsoft 365, Azure and Fabric.
- Tableau suits flexible visual exploration and Salesforce environments.
- A governed data model makes either tool reliable and easier to replace later.
Live Geospatial Claims Operations
Tableau operational dashboards with geospatial analytics deployed across Saudi Arabia.
- Geospatial OperationsReal-time accident dispatch by district
- Faster Response TimesResponse time cut from 15 → 4.5 minutes
 Snowflake

“Manual accident reporting was replaced with live operational dashboards, every claim, vehicle, and dispatcher mapped in real time. Response time dropped 70%.”
Quick answer
Power BI and Tableau are both mature, capable business intelligence tools, so the choice usually depends on your existing technology and your team rather than on features. Power BI tends to suit organisations already using Microsoft 365, Azure or Dynamics, and it fits naturally with Microsoft Fabric. Tableau tends to suit teams that prioritise flexible visual exploration or already work in the Salesforce ecosystem. In both cases, a clean data model matters more to the result than the tool itself.
Where Power BI fits best
- Microsoft estates: integration with Microsoft 365, Teams, Excel, Azure, and Microsoft Entra ID for sign-in and security.
- Microsoft Fabric: Power BI is part of Fabric, so data engineering, warehousing and reporting can share one platform.
- Broad self-service rollout: the interface feels familiar to Excel users, which helps adoption across large numbers of staff.
- Modelling: a strong semantic model, with DAX measures defined once and reused across reports.
- Self-hosting: Power BI Report Server is available for organisations that must keep reports in their own data centre, with fewer features than the cloud service.
Where Tableau fits best
- Visual exploration: analysts often value the freedom Tableau gives them to explore data and design custom visuals.
- Salesforce estates: Tableau is owned by Salesforce and connects well with its CRM and data products.
- Mixed technology environments: organisations that want a reporting layer independent of any single cloud provider.
- Self-hosting: Tableau Server can be installed on-premises or in a private cloud, alongside the hosted Tableau Cloud.
Arabic, right-to-left and hosting considerations
Both tools display Arabic text, but right-to-left layout, Arabic fonts, number formats and mixed Arabic and English labels need testing with your own reports before you commit. Build a small pilot report in Arabic that reflects real needs.
On hosting, check where each cloud service stores your data and whether that matches your data classification and privacy obligations. Both vendors also offer self-hosted options when data must stay in your own environment.
Licensing and your existing estate
Licensing for both products changes over time, so compare current terms directly with the vendors or their partners. Look at total cost, not only the price per user: include capacity or server costs, the number of people who only view reports, administration effort and training. Organisations with Microsoft enterprise agreements may already own some Power BI capability, and Salesforce customers may have similar arrangements for Tableau.
Why the data model matters more than the tool
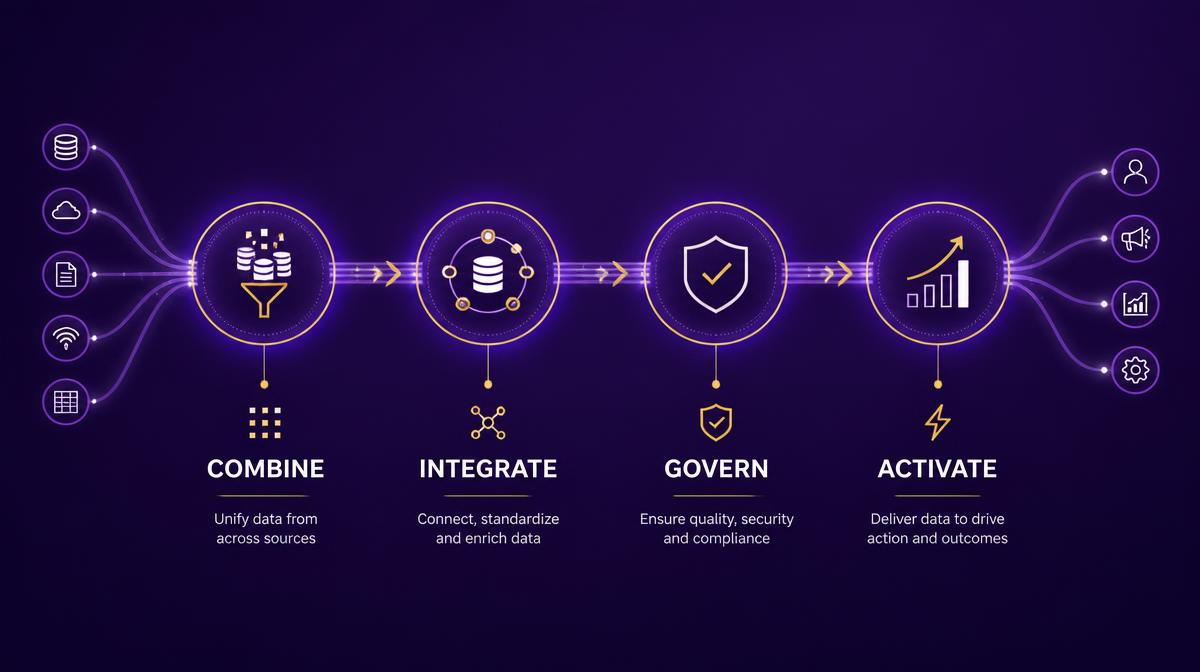
Most BI disappointments are not caused by the tool. They come from inconsistent definitions, duplicated data and reports built straight on top of live systems. A governed data layer, with agreed measures such as revenue, margin and on-time delivery, makes either tool reliable. It also means you can change tools later without rebuilding your business logic from scratch.
A simple way to decide
- List the reports and decisions you need first.
- Note your existing platforms: Microsoft, Salesforce or neither.
- Confirm hosting requirements for your data.
- Run a small proof of concept in both tools, using the same data and including an Arabic report.
- Ask the people who will use it every day which they prefer.
Next step
Bilytica builds business intelligence on both Power BI and Tableau, starting from the KPIs leaders use. Contact us for a neutral view, or read about our business intelligence service.
Frequently Asked Questions
Is Power BI better than Tableau?
Neither is better in every case. Power BI often suits organisations built on Microsoft 365, Azure or Fabric, while Tableau often suits teams focused on visual exploration or using Salesforce. Your data model matters more than the tool.
Can Power BI or Tableau run on-premises?
Yes. Power BI Report Server and Tableau Server can both be hosted in your own data centre or private cloud, alongside the vendors' cloud services. Feature sets differ between hosted and self-hosted versions.
Do Power BI and Tableau support Arabic?
Both display Arabic text. Right-to-left layout, fonts, number formats and mixed Arabic and English labels should be tested with your own reports before you commit.
Can we switch from Tableau to Power BI later, or the reverse?
Yes, especially if measures and definitions live in a governed data layer rather than inside individual reports. Reports must be rebuilt, but the business logic can be reused.
Want These Results for Your Company?
Book a free AI assessment and see exactly how much you can save, with numbers, not buzzwords.