
An NDMO-aligned data pipeline on Microsoft Fabric: a practical design
How Saudi teams can design a governed Microsoft Fabric pipeline, from KPI ownership and classification through ingestion, lineage, access and evidence.
Key takeaways
- Agree the KPI and owner before selecting a tool
- Classify fields and map each source-to-report flow
- Test quality, access and retention; keep evidence
Live Bilingual Ministerial Reporting
An SDAIA-aligned data platform with Arabic-English ministerial dashboards.
- Sovereign Data PlatformIn-country hosting, NDMO-aligned
- Vision 2030 KPIsLive tracking of national NTP indicators

“Ministerial reporting moved from monthly PDFs to live bilingual dashboards, every Vision 2030 KPI updated daily and shared across agencies.”
Quick answer
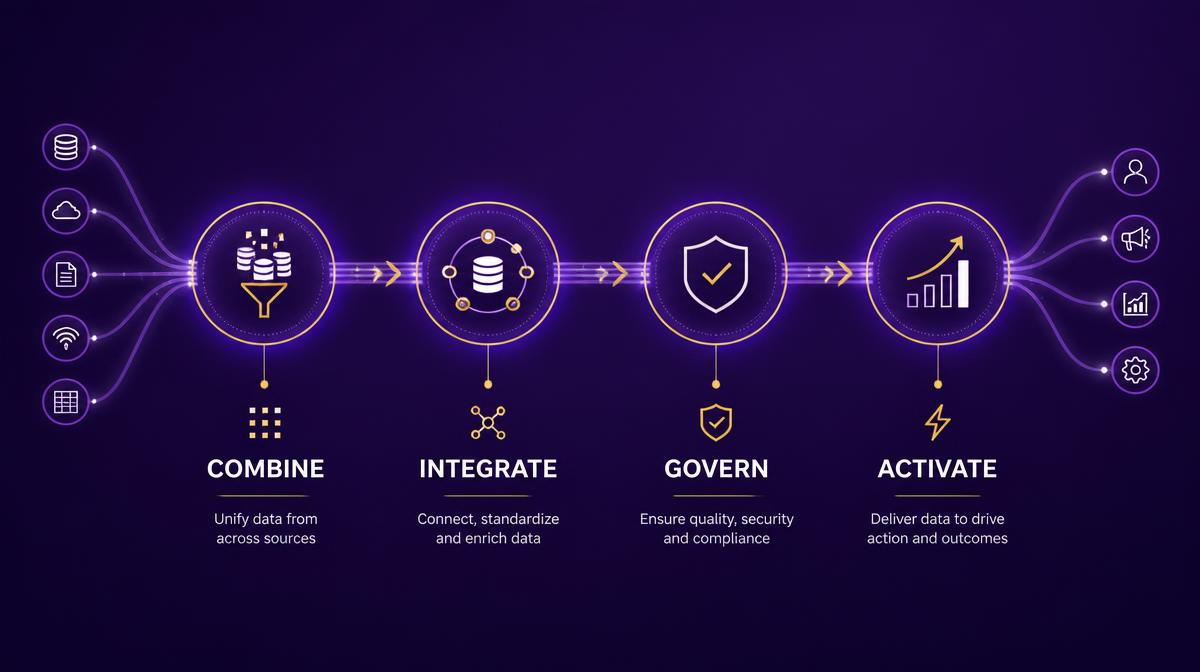
Start with the business question and the data classification, not a Fabric workspace. Name the KPI owner, source-system owner and permitted uses. Then map the data flow from source to report, specify controls for each hop, and retain the evidence needed to show how the pipeline operates. Microsoft Fabric can support this architecture; a product selection alone does not establish NDMO compliance.
1. Agree on the decision and KPI
Write down the decision the pipeline supports, the KPI formula, its grain and refresh requirement. For example, a service-performance dashboard may need one agreed definition of completed requests. Business owners approve the definition; IT confirms whether source events and timestamps can support it. If two departments count a request differently, resolve the definition before building a semantic model.
2. Inventory and classify the inputs
List each source, its custodian, fields, sensitivity, residency constraints, retention rule and authorized users. Separate personal data from operational metrics. Confirm the applicable NDMO controls with your governance and legal teams; PDPL questions require their own assessment. Do not assume that every Saudi dataset has the same residency or sharing requirement. Document what may leave a source system, what may be transformed and what must be masked or excluded.
3. Map the Fabric architecture to the control design
A typical pattern ingests approved source extracts into a controlled OneLake landing area, validates schema and quality, then publishes curated tables for a governed Power BI semantic model. Use environment separation and least-privilege workspace access. Document how identity, encryption, logging and backup are configured in the actual tenant. Where a source cannot be replicated, consider a controlled alternative rather than copying data by default. Review the deployment region and every connected service, not only the primary workspace setting.
4. Build quality rules before dashboards
Test completeness, uniqueness, validity and timeliness against business-approved thresholds. Quarantine unexpected values instead of silently fixing them. Maintain a rejected-record log with owner and resolution status. Reconcile source totals to curated totals and record approved exceptions. A dashboard that loads quickly but cannot explain its numbers is not a decision system.
5. Establish shared definitions and lineage
Maintain a data dictionary with KPI formula, source fields, transformations, refresh schedule and owner. Trace each metric through ingestion, transformation and semantic model to the report. Record who approved changes to the formula. Lineage is useful only when the team can answer a concrete question: why did this number move, and which source or rule changed?
6. Test access and retention as operating controls
Use role-based access for ingestion operators, analysts and viewers. Test row-level and object-level access with realistic user accounts. Apply retention and deletion rules to raw, curated and exported data, including caches and downstream extracts. Review audit logs and incident paths with security. A policy document without a working test is not enough.
7. Publish a small, reviewable evidence pack
Keep the approved KPI definition, classification decisions, source-to-report map, access matrix, quality results, retention configuration and change log together. Have business, IT, governance and security sign off on what they own. Revisit controls when a new source, AI use case or sharing destination is introduced.
What to ask before go-live
Can a data owner explain every field? Can an analyst reproduce a number from the source? Can security show who saw sensitive data? Can the business owner name what action a KPI should trigger? If the answer is no, improve the pipeline before widening access.
Related reading
See the analytics approach for KPI-first discovery, the NDMO-aligned lakehouse guide for a broader architecture, and contact Bilytica to discuss a governed data foundation.
Sources to verify against your current obligations
- National Data Management Office — national data governance policies and standards.
- Saudi Data & AI Authority — personal data protection resources.
- Microsoft Fabric documentation — product capabilities and configuration.
Want These Results for Your Company?
Book a free AI assessment and see exactly how much you can save, with numbers, not buzzwords.